Visualization tool in ZenBase produces visualizations that are normally difficult to produce with other software. ZenBase has a very specificated visualization tool built-in with the goal of making the visual representation of complex data easy for everyone.
In our tutorial, we will visualize our data in “bar chart”. The table must contain at least two columns: one containing the name of the categories (for X-axis), the second one containing their values (for Y-axis).
1. Click “Visualization” button
First of all, once the table is loaded on the screen, select “Visualization” from the table tools.

2. Choose a chart layout
After click “Visualization” button, for the sake of simplicity, select the “bar chart” visual model, which is the simplest chart type. You can certainly choose other chart types you prefer.

3. Map your dimensions
It’s time to map your data and create the visualization. On the left, you have the list of dimensions in your dataset, on the right the available visual variable of the bar chart layout.
 4. Refine and export
To reach the final results we can customize the visualization with some parameters you can find next to the visualization.

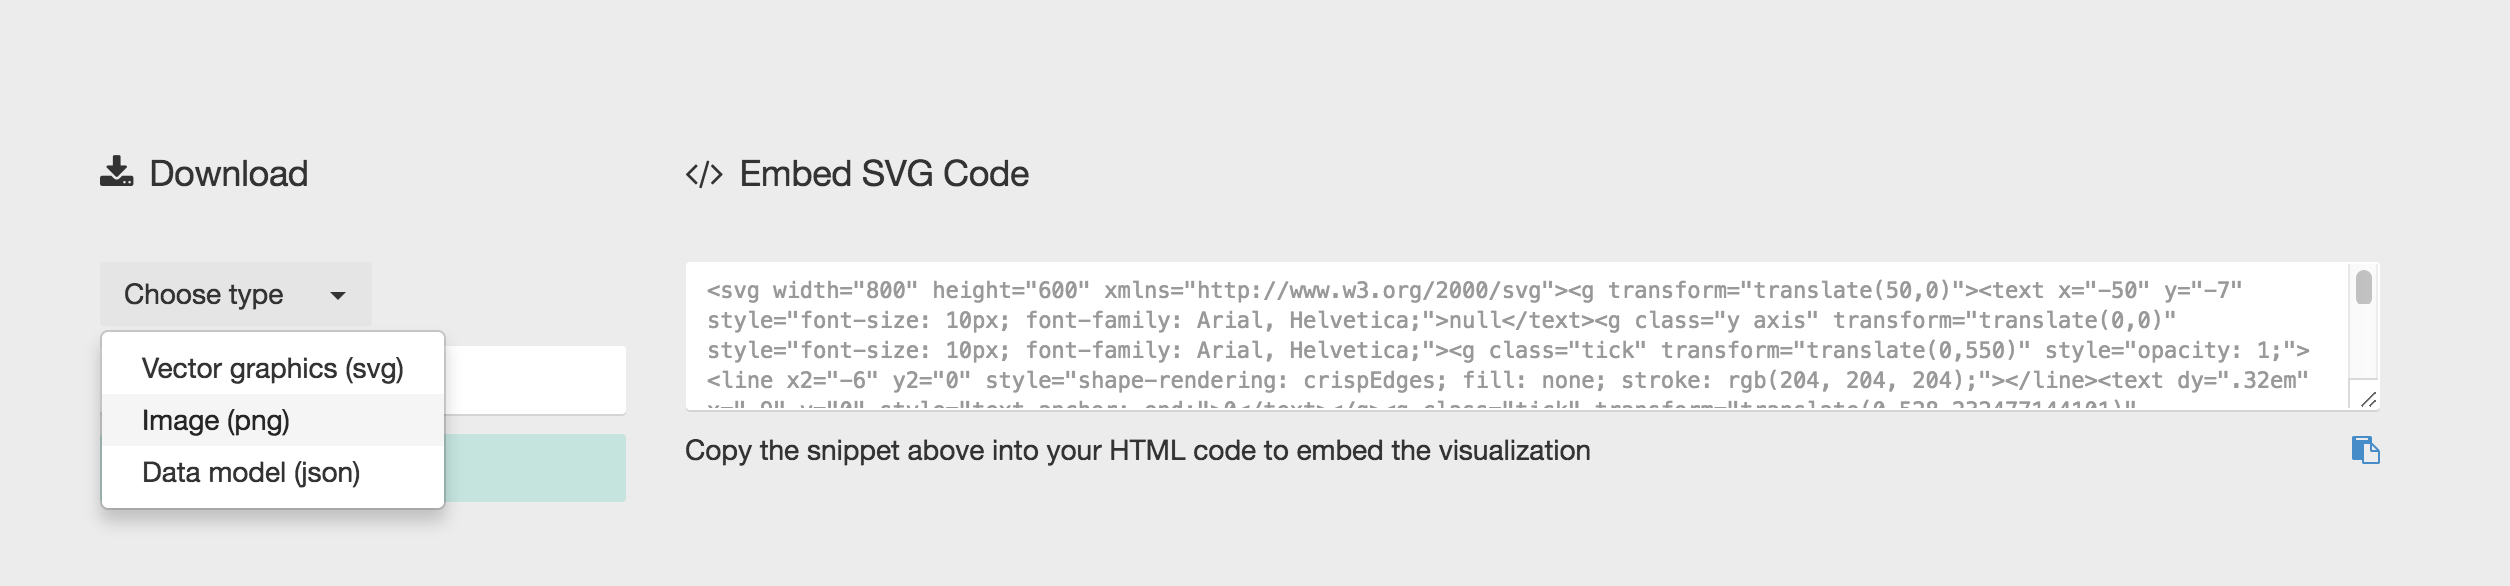
5. Download or Embed the Reports
You can choose to download the visualization directly in SVG, PNG, or JSON, then share with others as an email attachment. You can also directly embed the generated report visualization in your own web page.
Demo: Video walk-through (click to view in full screen)
Next, you’ll see a quick demonstration of the basic features of the visualization tool. Simply click the “Visualization” and pick your model, then map your dimensions and you’re ready to go.
Common Questions:
Can I edit the visualizations?
Yes. You can export the visualization in vector format (SVG) and open it with any vector graphics editor (e.g. Adobe Illustrator, Sketch, Inkscape, …)
Can I embed a visualization on my website?
Sure! You can just copy and paste the code you find at the bottom of the app into any HTML page to embed it.